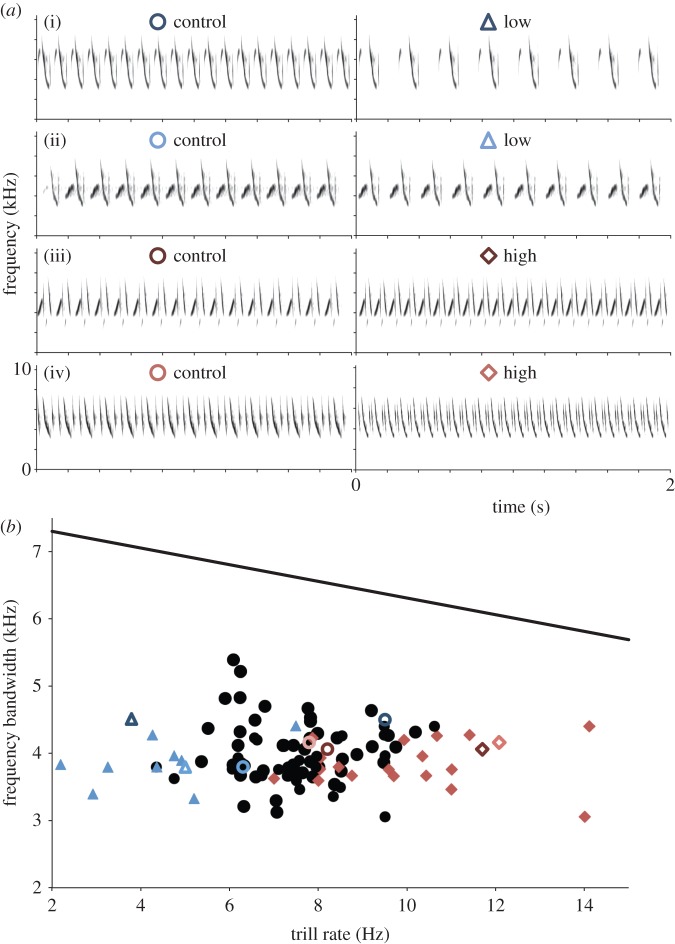
Figure 1.
(a) Example spectrograms of playback stimuli used in control and manipulated performance trials. Each subject was presented with two versions of one song type, one at its natural trill rate (left column) and the other version at either a reduced trill rate (experiment 1, right column rows (i) and (ii)) or an elevated trill rate (experiment 2, right column rows (iii) and (iv)). (b) Frequency bandwidth (kHz) plotted as a function of trill rate (Hz) for stimulus and subject songs. The family-wide ‘upper-bound regression’ (line of descending slope), from which ‘vocal deviation’ values are calculated, is provided for reference (see text and Podos [17]). Plotted are control stimuli and songs from subject males (circles), low-performance stimuli (triangles, experiment 1) and high-performance stimuli (diamonds, experiment 2). Open symbols correspond to the eight spectrograms shown above. (Online version in colour.)

