
Figure 2.
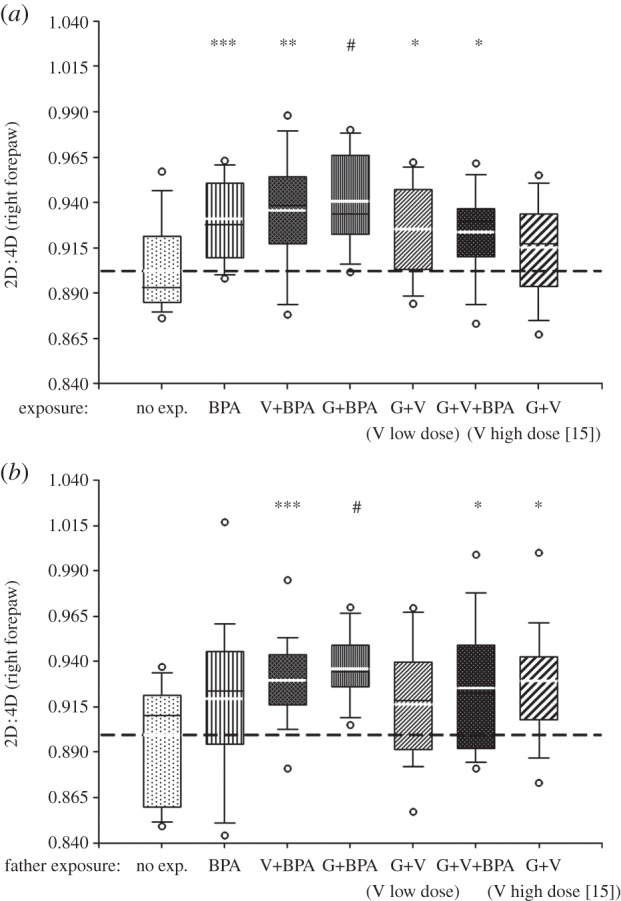
Box plot displaying the 10th, 25th, 50th, 75th and 90th percentile values, the extreme 5th and 95th percentiles (circles) and the mean value (thick white line) for right forepaw 2D : 4D in (a) the F1 males exposed to the compounds and (b) in their unexposed male offspring (F2) carried by unexposed dams. Mann–Whitney non-parametric comparisons (#p < 0.001, ***p < 0.005, **p < 0.01, *p < 0.05) versus controls (abbreviations for both the F1 and F2 and doses for the F1: BPA, bisphenol A, 5 µg kg−1 d−1; V, vinclozolin, 10 µg kg−1 d−1, ‘low’ or 1000 µg kg−1 d−1 ‘high’ and G, genistein, 1000 µg kg−1 d−1, see [15]).