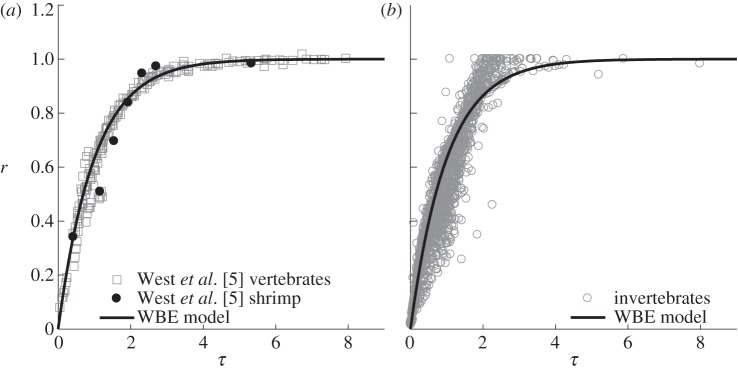
Figure 1.

Plots of dimensionless mass (r) against dimensionless time (τ). (a) Data from the original West et al. [5] paper, containing mostly vertebrate examples (12 of 13 species). The single invertebrate species included in their study is highlighted in black. (b) Data from this study for marine invertebrates. In both plots, a comparison with the WBE model, equivalent to the universal growth curve 1−exp−τ [5], is given. r is the dimensionless mass variable (m/M)1/4; τ is the dimensionless time variable (at/4M1/4) − ln(1−(m0/M)1/4). Parameters are defined in equation (1.2).
