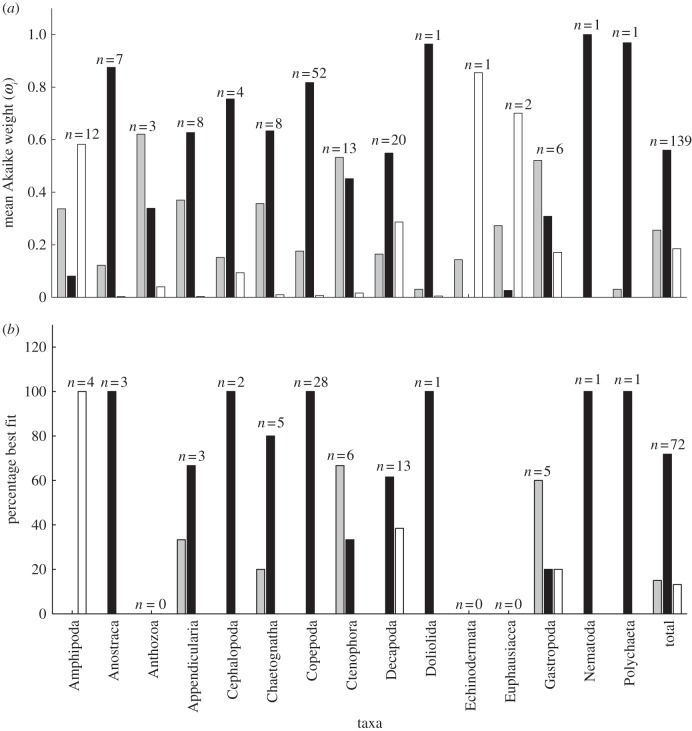
Figure 3.
(a) Comparison of the best-fit models (power, exponential or WBE), calculated using Akaike weights (see electronic supplementary material, appendix S2). Mean Akaike weights are determined by the sum of ωi for each model for each taxon divided by the number of datasets for each taxon. (b) Frequency of best fit for each model type (%) for those datasets where one of the three models was deemed better than the other two. WBE, West Brown and Enquist model [5]; n, the number of separate growth curves for each taxon. Grey bars represent power model, black bars represent exponential model and white bars represent WBE.

