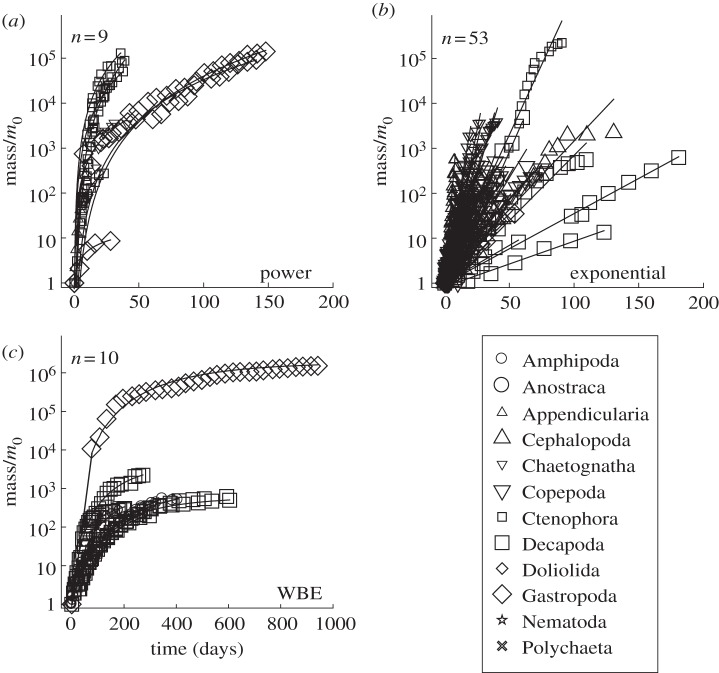
Figure 4.
Normalized mass (mass divided by progeny mass, m0) on a log scale as a function of time (days) for marine invertebrate taxa. Growth trajectories are shown by the model ((a) power, (b) exponential and (c) WBE) that is the best fit, for datasets where one model was deemed better than the other two, as determined from Akaike weights. n is the number of cases in which each particular model was best.

