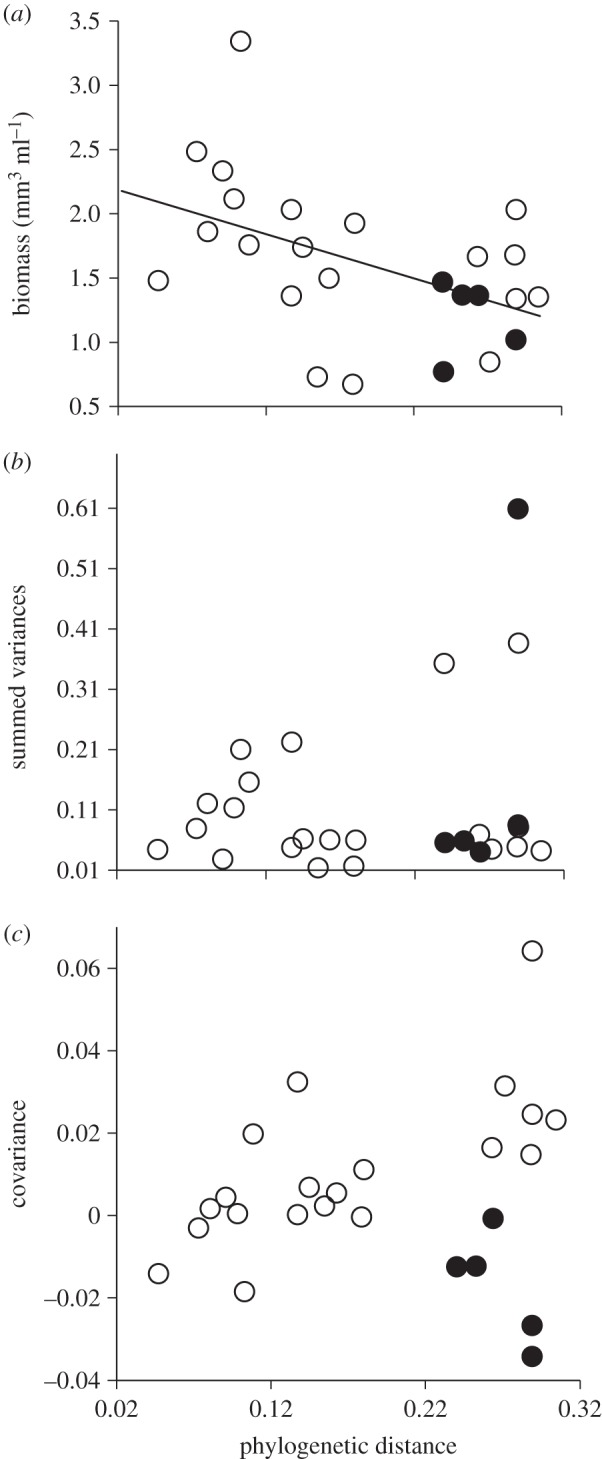
Figure 2.

Effects of PD on the three components of stability. (a) Effect of PD on mean temporal biomass of algal bicultures. The solid line represents the general linear relationship, which is only significant when C. turpinii is included (see main text). (b) Effect of PD on the summed variances. (c) Effect of PD on the temporal covariance. In (a–c), each dot represents a single biculture, with black dots showing those bicultures that include the low productivity-superior competitor C. turpinii.
