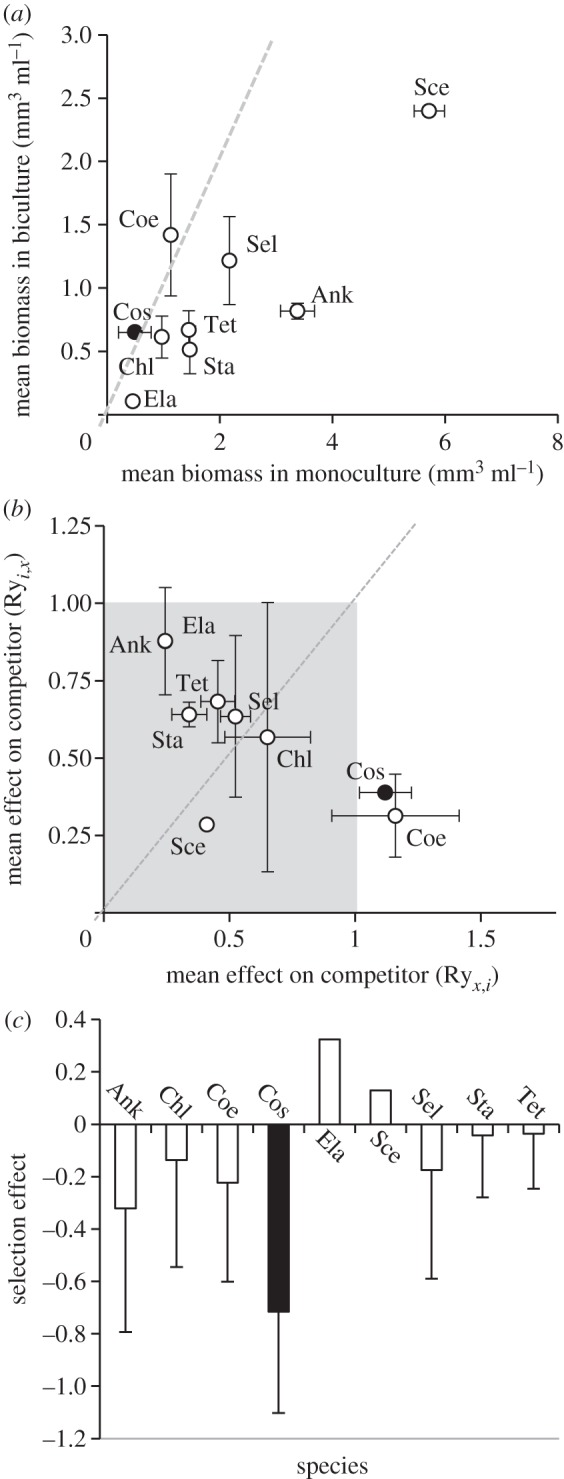
Figure 3.

Species biomasses, competitive capacities and selection effects. (a) The nine species differed in their mean temporal biomasses achieved in monoculture (x-axis) and in their mean biomasses in biculture in the fluctuating treatment (y-axis); black dot shows C. turpinii; (b) Species also differed in their competitive abilities as indicated by differences in RYs. The grey zone represents RY values less than 1. (c) Mean selection effect of bicultures including each of the nine species used in this experiment. (Ank, Ankistrodesmus; Chl, Chlorella; Coe, Coelastrum; Cos, Cosmarium; Ela, Elakatrothrix; Sce, Scenedesmus; Sel, Selenastrum; Sta, Staurastrum and Tet, Tetraedron). Error bars represent standard errors among bicultures containing the species. Ela and Sce have no error bars because only present in one biculture. Dashed lines in (a,b) represent the 1 : 1 isocline.
