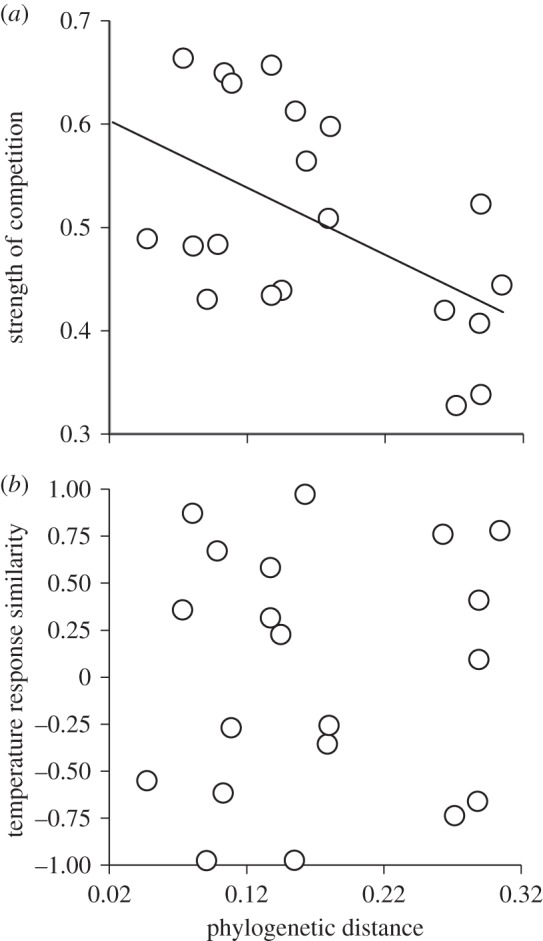
Figure 5.

Effect of PD on competition and environmental responses' similarity. (a) The strength of interspecific competition measured as the opposite of the mean RY of the two interacting species (1 – RYcom). (b) Similarity in specific responses to a temperature gradient from 13°C to 23°C. Each dot represents one of the 20 bicultures. Bicultures including C. turpinii were not included in this analysis. The solid line in (a) represents a significant linear relationship.
