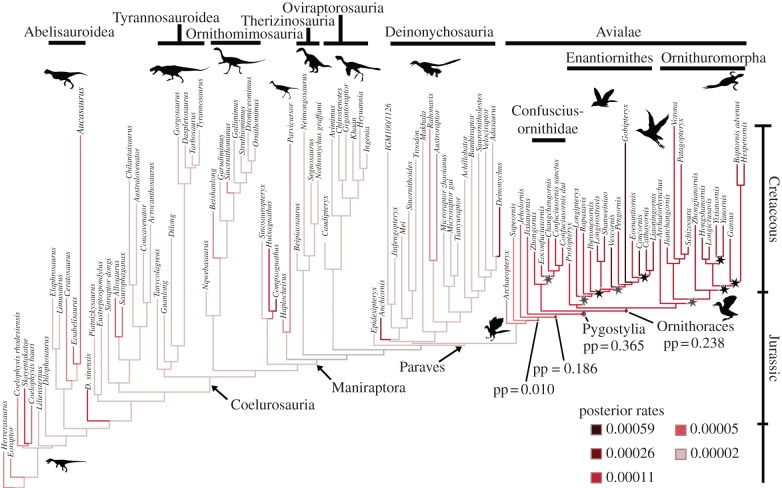
Figure 3.
Rate of morphological evolution and cladogenesis. Posterior model-averaged rates (Brownian variance in (log10(mm))/(Myr)) of relative tibia length (hindlimb PC3) in Mesozoic theropods (N = 107) resulting from Bayesian estimation are shown by branch colours, according to the legend. Localized hindlimb PC3 rate shifts are indicated by circles at nodes and their posterior probabilities stated. Stars indicate significant tree imbalance on the complete tree (a pruned version is shown here) according to either Δ1 or Δ2 shift statistics [31], indicating diversification rate shifts among pygostylian birds. Grey stars are shifts recovered using a tree of only Early Cretaceous and younger taxa and black stars are shifts recovered from the tree including all taxa. Taxon ages are independently drawn from a uniform distribution within their substage of occurrence. (Online version in colour.)

