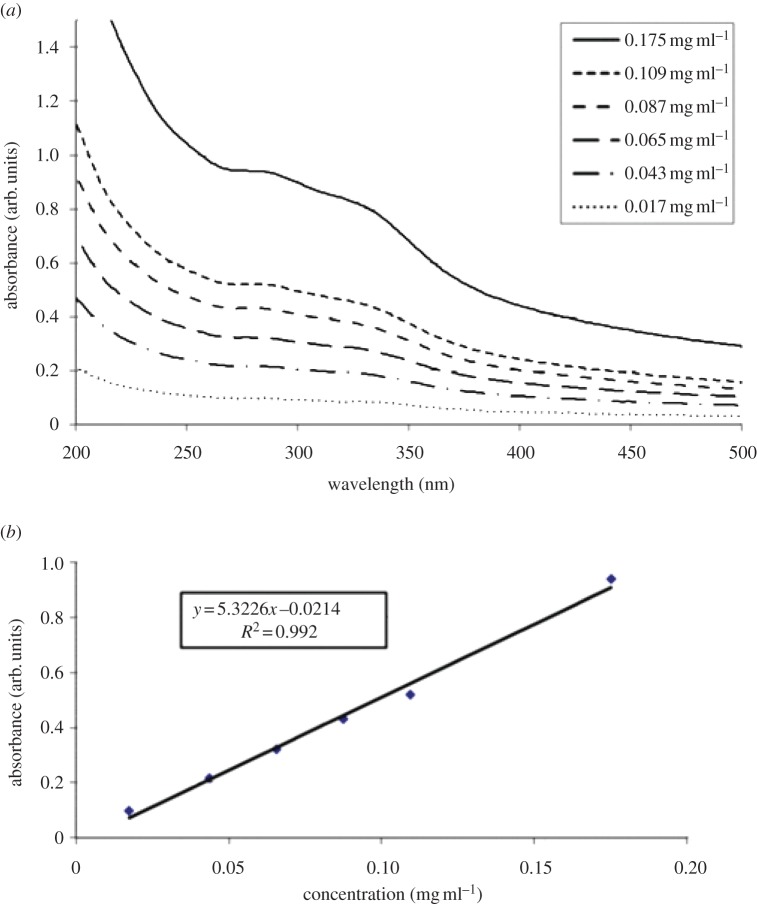
Figure 4.
(a) UV/vis spectra of the ivy nanoparticle fraction collected directly from the HPLC column. Note the wide absorbance from 200 to 350 nm, before dropping off in the visible region. (b) A plot of absorbance versus concentration at 283 nm clearly shows the direct effect of the nanoparticle concentration on the absorbance. (Online version in colour.)

