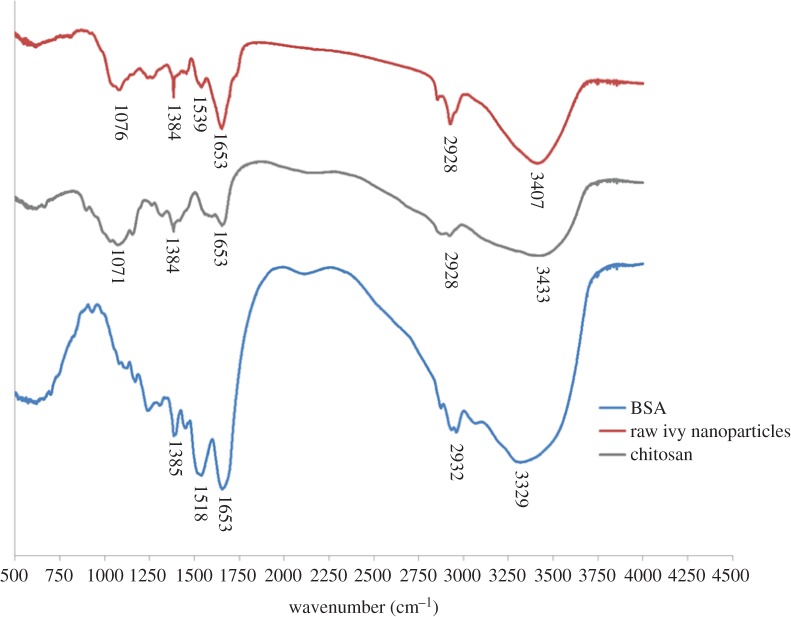
Figure 6.
FTIR spectrum of the ivy nanoparticles. The FTIR spectrum for the ivy nanoparticles was compared with reference spectra for chitosan (a representative polysaccharide) and BSA (a representative protein). All three samples had a band at 1653 cm−1, indicating vibration around the CO–NH bond, and around 2928–2932 cm−1 indicating C–H vibration. In addition, the ivy sample shared a peak at 1071–1076 cm−1 with the chitosan sample, indicating vibration of a CO–C bond, typical of sugars. This band was not present in the BSA sample. Similarly, the BSA sample had a strong peak at 1518 cm−1, representing the amide II band, whereas the ivy nanoparticles had a weak band at 1539 cm−1, indicating a weak amide II band, and the chitosan sample had no peak in this region. The FTIR spectra from top to bottom are: raw ivy nanoparticles, chitosan and BSA. (Online version in colour.)

