
Figure 4.
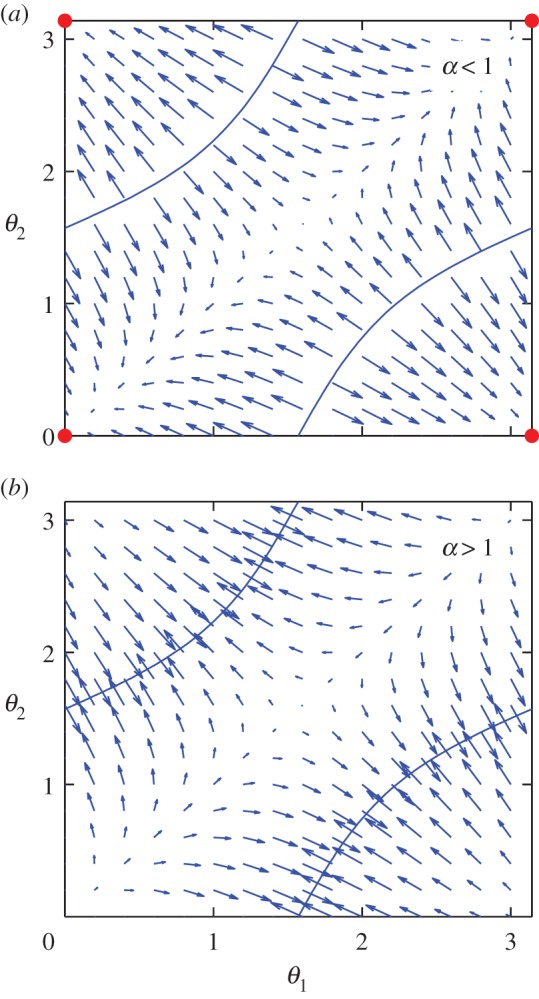
Theoretical convergence maps for two oscillators in the configuration shown in figure 3 for (a) α < 1 and (b) α > 1. The set of angles (θ1, θ2) evolves in time by following the arrows. When α < 1, the angles converge to (0, 0) (large dots). When α > 1, the direction of the arrows are all swapped, and the angles converge towards a point on the blue zero-rr-coupling lines, leading to a temporary loss of synchronization. These graphs agree with the distributions in figure 3 in the middle-range of Rf/Rg. (Online version in colour.)