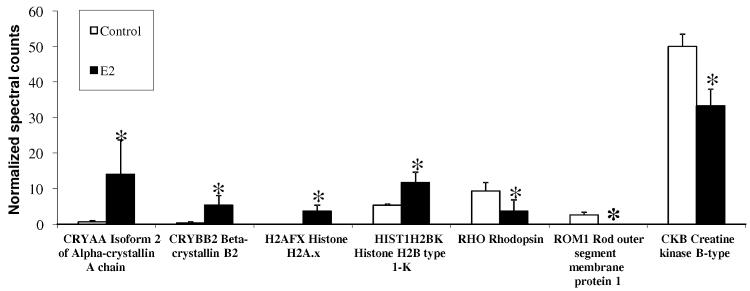
Figure 3.
Mass spectrometry-based retina proteomics. Normalized spectral counts obtained from data-dependent LC-MS/MS analyses are measures of protein abundance. Asterisks indicate statistically significant difference from control (summation-based G-test, p<0.05; three biological replicates per group and two analytical replicates per sample). Several differentially expressed proteins (up- and downregulated compared to vehicle control) were found in the retina of OVX rats after 19-day q.d. treatments with E2 (0.05%, w/v in 20% w/v HPCD-containing saline vehicle).

