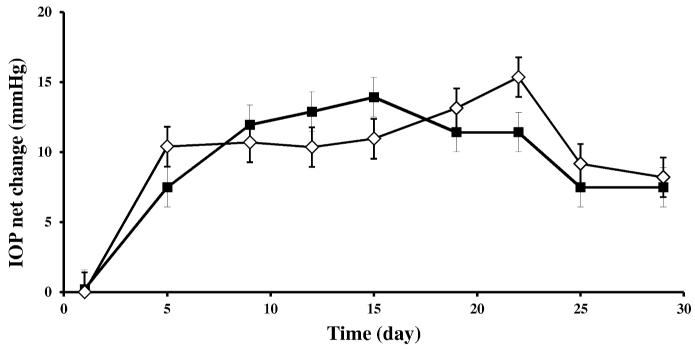
Figure 4.
IOP changes in a rat model of glaucoma after vehicle (20% w/v, HPBCD in saline, ◇) and E2 (0.05%, w/v in vehicle, ■) eye drop treatments (10 μL, q.d., for 19 days) in the ipsilateral eye of OVX rats. The contralateral eye served as untreated control. Each graph represents mean IOP values in mmHg ± S.D. for net changes between the experimental (ipsilateral) eye and the control (contralateral) eye for four individual animals per group maintained for 30 days. Day zero was the day of initiation of IOP elevation.

