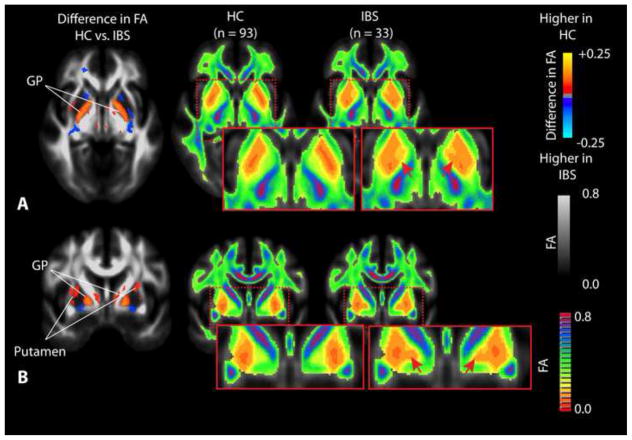
Figure 2. Differences in fractional anisotropy (FA) within the basal ganglia.
A) Axial SPMs showing a higher FA in the globus pallidus (GP) in HCs compared to patients with IBS, along with average color FA maps for both HCs and IBS patients showing dramatic changes within the basal ganglia. B) Coronal SPMs showing higher FA in the GP as well as the putamen in HCs when compared with IBS patients, which is also apparent when examining the average color FA maps for both HCs and IBS patients directly. Red arrows show regions of dramatic difference on color FA maps between HC and IBS patients.

