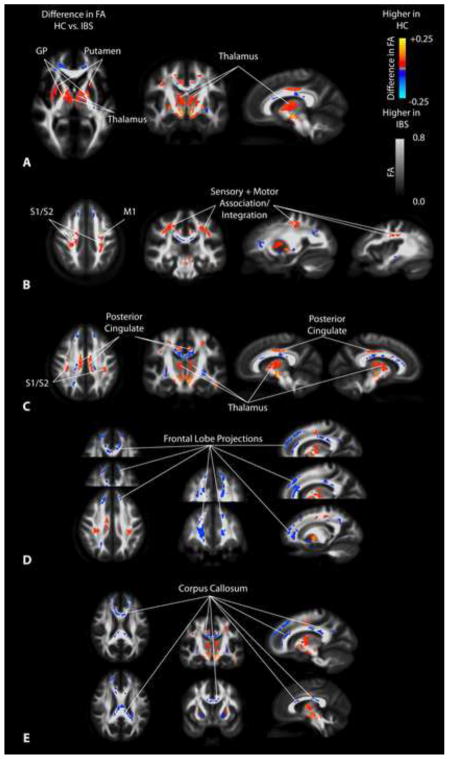
Figure 3. SPMs showing regions of statistically different fractional anisotropy (FA) in IBS compared to HCs.
A) SPMs showing higher FA in the globus pallidus (GP), putamen, and medial thalamus in HCs compared with IBS patients. B) SPMs demonstrating higher FA in sensory and motor association regions as well as primary cortical projections from the thalamus in HCs compared with IBS patients. C) SPMs illustrating higher FA in the thalamus and posterior cingulate white matter in HCs compared with IBS patients. D) SPMs demonstrating higher FA in the frontal lobe and the anterior cingulate white matter regions in IBS patients compared to HCs. E) SPMs illustrating higher FA in regions of the corpus callosum in IBS patients compared with HCs.

