Figure 5.
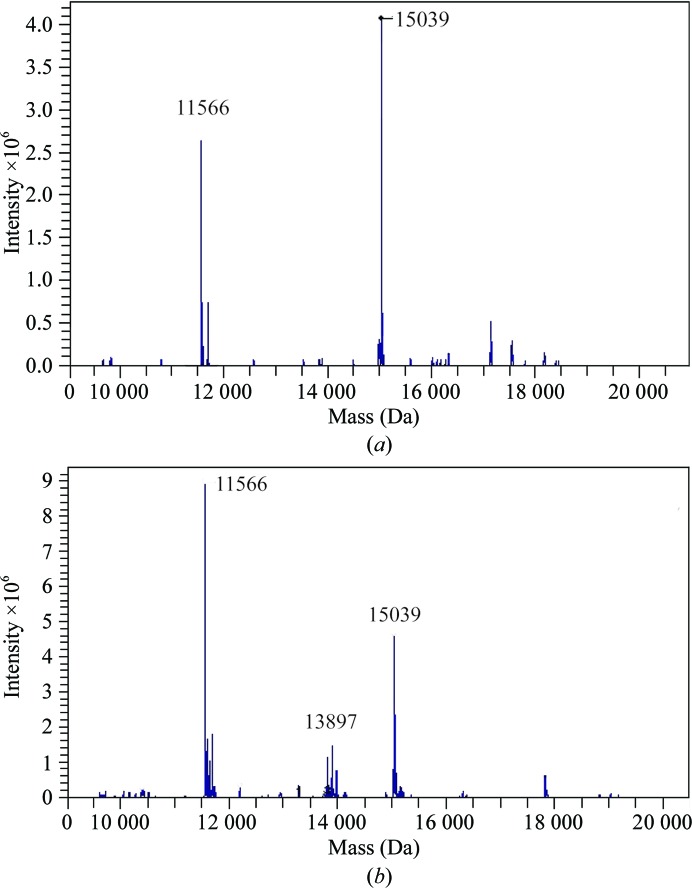
Mass-spectrometric analysis of crystal contents. (a) ESI ion trap mass spectrum of crystal form I of the HigBA2 complex. A first major peak at 11 566 Da corresponds to the mass of the HigA2 antitoxin within 1 Da experimental error. The second major peak corresponds to a mass of 15 039 Da, again within 1 Da experimental error of the theoretical mass of the HigB2 toxin. (b) Identical ESI ion trap mass spectrum for crystal form II. Note the different ratio of peak intensities suggesting a different stoichiometry of the complex and the presence of a peak at 13 897 Da corresponding to a putative HigB2 degradation product.

