
Figure 6.
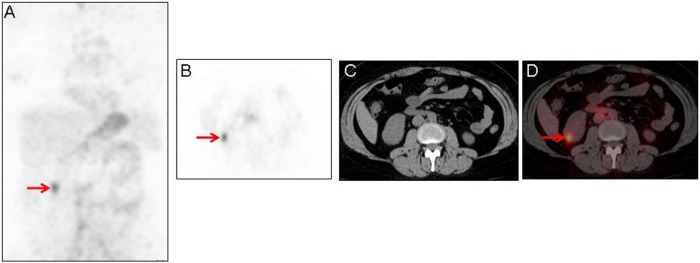
Maximum-intensity projection image (A), axial 124I-labeled chimeric monoclonal antibody G250 (124I-cG250) positron emission tomography (PET) image (B), axial attenuation correction non-contrast-enhanced computed tomography (CT) for 124I-cG250 PET localization (C), and fused axial 124I-cG250 PET/CT image (D) demonstrating increased 124I-cG250 activity in the inferior pole of the right kidney (A, B, and D; red arrows) that corresponds to the mass seen on the prior diagnostic contrast-enhanced CT of the abdomen in Figure 5. Note that there is little to no 124I-cG250 activity in the remainder of either kidney.