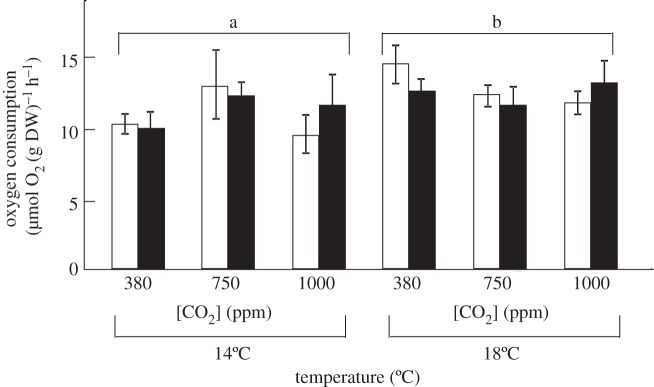
Figure 2.

The effect of temperature (14°C versus 18°C) and CO2 (380 versus 750 versus 1000 ppm) on the mean (±s.e.) metabolic rates (μmol O2 (g DW)−1 h−1) of 5-month (open bars) and 2-week (filled bars) gastropods. SNK tests are presented on the figure, where different letters show significant differences.
