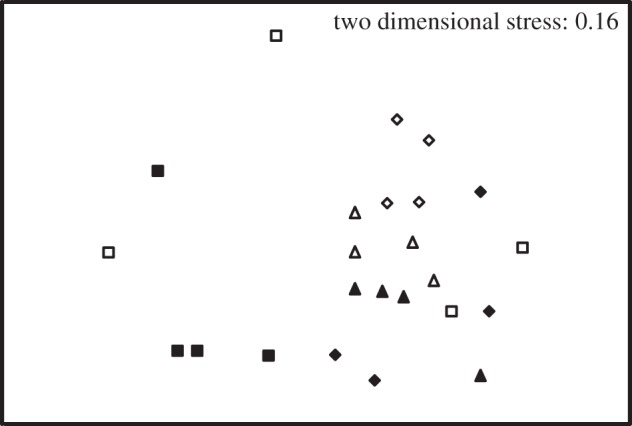
Figure 5.

Effect of CO2 and temperature on cyanobacterial community structure as assessed by PCR-DGGE. The plot shows a non-metric multi-dimensional scaling (MDS) ordination of a Bray–Curtis resemblance matrix, generated from presence/absence of DGGE bands. Open symbols represent samples incubated at 14°C and closed symbols are from 18°C incubations. Triangles, 380 ppm CO2; diamonds, 750 ppm CO2; squares, 1000 ppm CO2.
