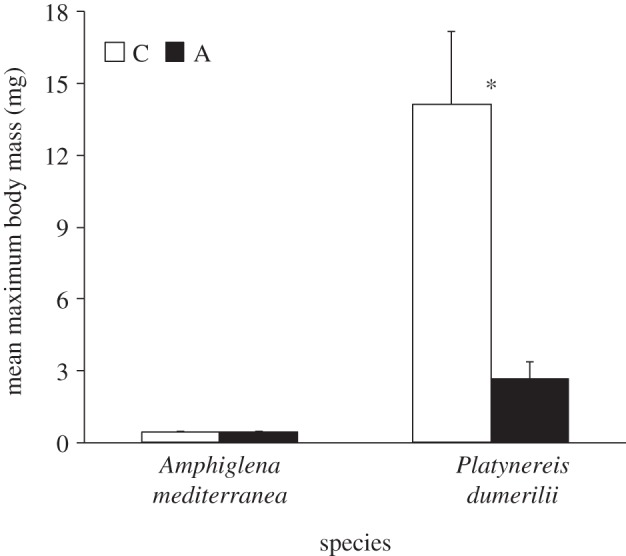
Figure 6.

Effect of exposure to different pCO2 conditions on the mean maximum body mass of the tolerant species A. mediterranea and P. dumerilii collected from either low pCO2/elevated pH conditions outside the vents or elevated pCO2 conditions within the vents Histograms present mean values ± s.e. Asterisk (*) indicates a significant difference between the mean maximum body mass measured under acidified conditions (A) and control conditions (C), according to a GLM test.
