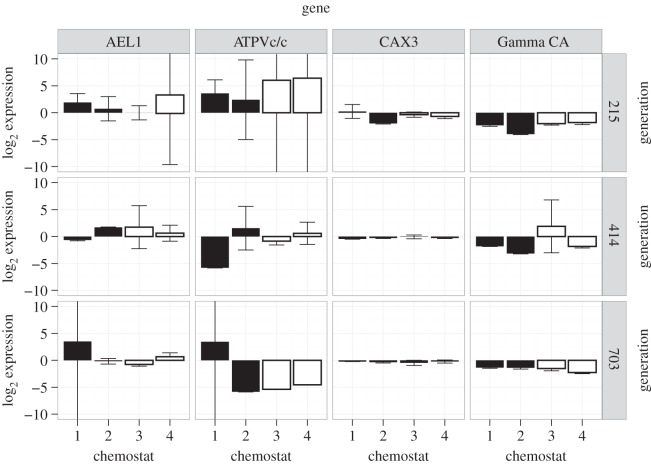
Figure 7.
Quantitative real-time PCR (qPCR) data for calcification-related genes selected from the literature. Bars represent means±s.d. actin-normalized expression levels for each gene from two filters from each chemostat at each generation point under present ocean condition (383 ± 43 µatm pCO2, 20.0 ± 0.1°C; white bars) and future ocean condition (833 ± 68 µatm pCO2, 24.0 ± 0.2°C; black bars; electronic supplementary material, table S1). Each filter was assayed in three replicate qPCR reactions. If error bar horizontal lines are not visible, the error bars are larger than the y-axis boundary.

