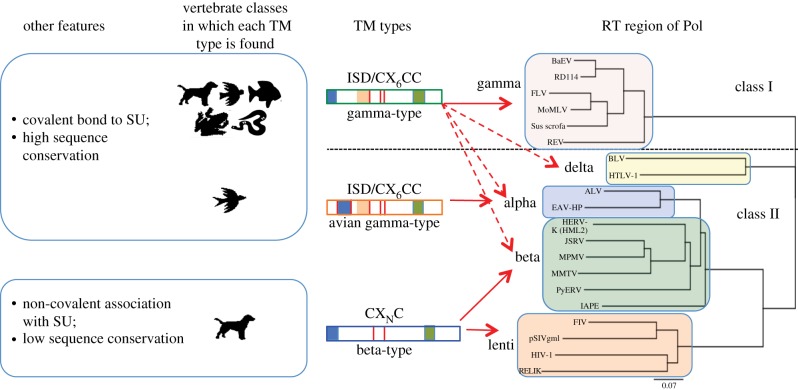
Figure 2.
Distribution of TM types among retroviral genera and vertebrate classes. At the right is a neighbour-joining tree based on an alignment of the RT regions of Pol for an assortment of endogenous and exogenous retroviruses. The horizontal dotted line divides class I and class II sequences. The five genera in which these three TM types are found are indicated to the left of the coloured rectangles. In the middle are cartoons representing each TM type; vertical red lines indicate cysteines; blue, orange and green boxes represent the fusion peptide, ISD and the transmembrane region, respectively. Arrows indicate genera in which each TM type is found, with dashed arrows indicating where the gamma-type was acquired via a recombination event. Animal icons represent vertebrate classes—mammals, birds, fishes, amphibians and reptiles.

