
Table 1.
Divergence rates among TM types.
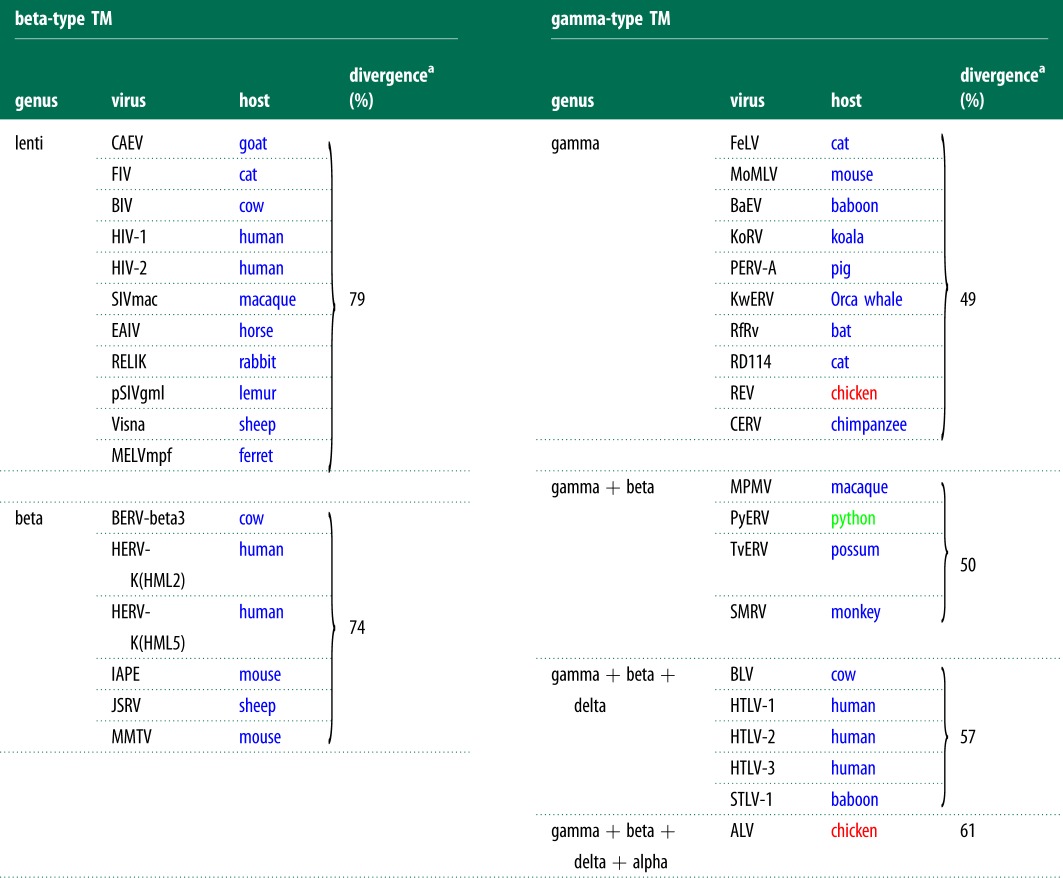 |
aAs measured by (1 − average pairwise identity) at the amino acid level; blue font represents the mammalian class; red, the avian class; green, the reptilian class.
Official websites use .gov
A
.gov website belongs to an official
government organization in the United States.
Secure .gov websites use HTTPS
A lock (
) or https:// means you've safely
connected to the .gov website. Share sensitive
information only on official, secure websites.
Divergence rates among TM types.
|
aAs measured by (1 − average pairwise identity) at the amino acid level; blue font represents the mammalian class; red, the avian class; green, the reptilian class.