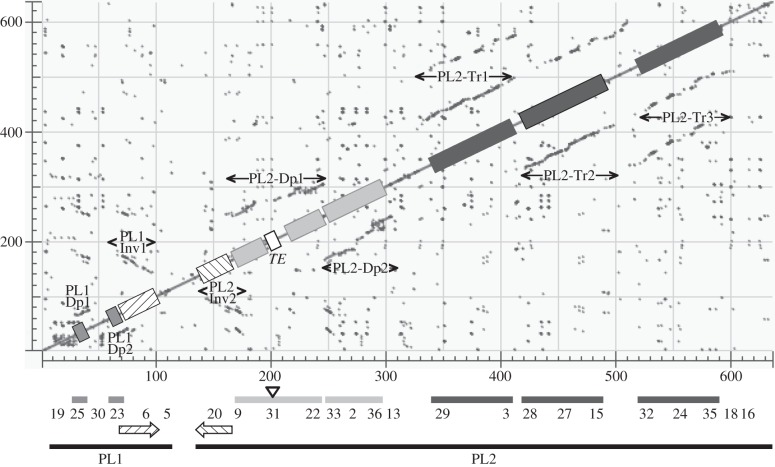
Figure 5.
Similarity matrix of the C. congregata proviral macrolocus compared with itself. The main diagonal represents sequence alignment with itself; dotted lines (grey) identify duplicated regions within the sequence analysed. Those parallel to the diagonal correspond to duplicated regions in the same orientation; those antiparallel correspond to inverted sequences (striped arrows). Scale is expressed in kilobase pair. Relative positions of proviral loci 1 and 2 and of each CcBV proviral segment forming the macrolocus are indicated below the dot plot matrix. PL1, proviral locus 1; PL2, proviral locus 2; TE, transposable element. Grey boxes: duplication PL1–Dp1/PL1–Dp2 within PL1; striped boxes: inverted duplication PL1–Inv1/PL2–Inv2; light grey boxes: duplication PL2–Dp1/PL2–Dp2; dark grey boxes: triplication PL2–Tr1/PL2–Tr2/PL2–Tr3. Nucleotide positions of duplication extremities are indicated in the electronic supplementary material, table S6.

