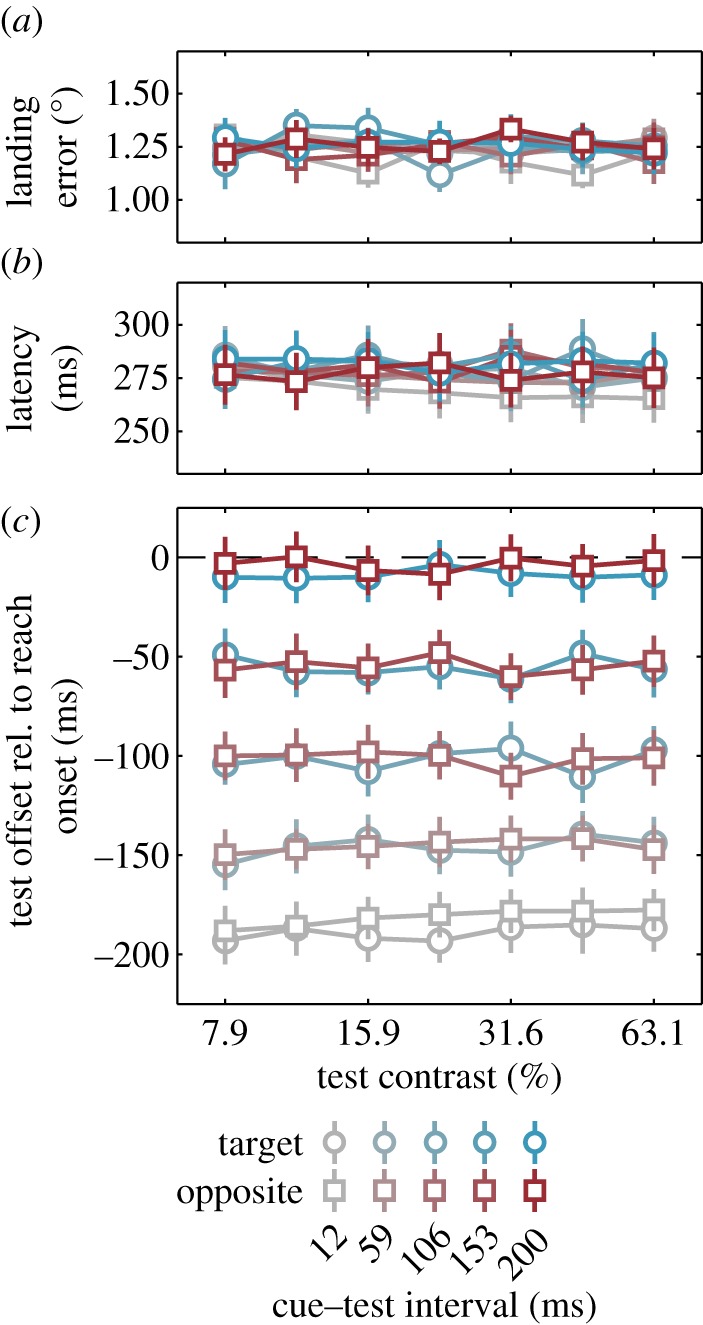
Figure 3.

Reach performance and test stimulus timing. (a) Average landing site error, (b) reach latency and (c) test timing relative to reach onset, plotted for each CTI, test location relative to the reach target and test contrast. Error bars are s.e.m. (Online version in colour.)
