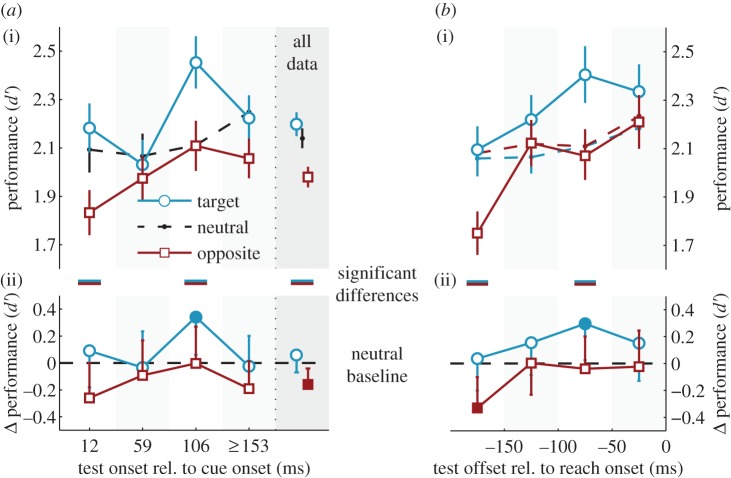
Figure 4.
Orientation discrimination performance, expressed as d′, as a function of test stimulus location relative to the reach target (target or opposite) and time of test stimulus presentation, relative to both (a) cue onset and (b) reach onset. In a(i) and b(i) we show the average data with s.e.m. In a(ii) and b(ii) we re-plot the data from panels a(i) and b(i) as the difference of the two reach conditions from their neutral baseline, with 95% CIs. We constrained all analyses to trials in which the test stimulus presentation had been completed before the reach (§4d). In (a) therefore, the last time bin (greater than or equal to 153 ms) pools the 153 and 200 ms CTIs, because observers with short reach latencies had very few trials long after the cue. In ‘all data’, we computed d′ by pooling trials from all CTIs. In (b), neutral baselines were computed separately for the target and opposite conditions, and plotted in the corresponding colours (dashed lines). Filled symbols highlight significant deviations from baseline. Lines in between (i) and (ii) highlight significant differences between the two reach conditions (target versus opposite). (Online version in colour.)

