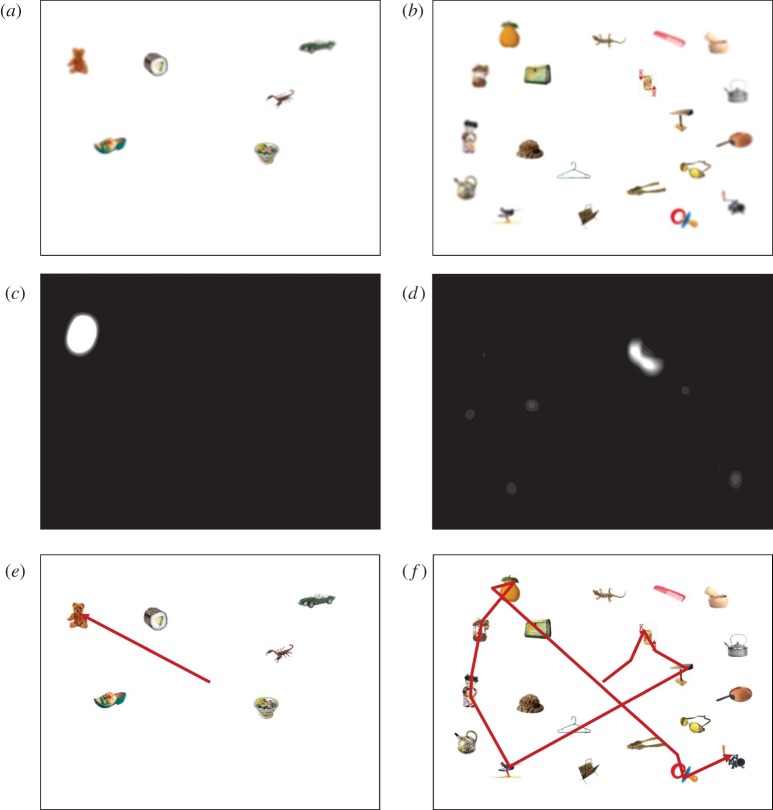
Figure 1.
Representative search displays and behaviour from the model. (a,c,e) and (b,d,f) Images from two different trials. (a) Set size 6 search display, blurred to reflect acuity limitations as viewed from the centre. (b) Set size 20 search display, also blurred to reflect acuity limitations as viewed from the centre. (c) Target map generated from (a), reflecting activation before the initial eye movement. (d) Target map generated from (b), reflecting activation before the initial eye movement. (e) Eye movements preceding a correct target-present judgement. (f) Eye movements preceding a correct target-absent judgement. Note that each fixation would have associated with it a new blurred search display (as shown in a,b) and a new target map (as shown in c,d). The degree of blur can be seen by comparing (a,b) with (e,f). (Online version in colour.)

