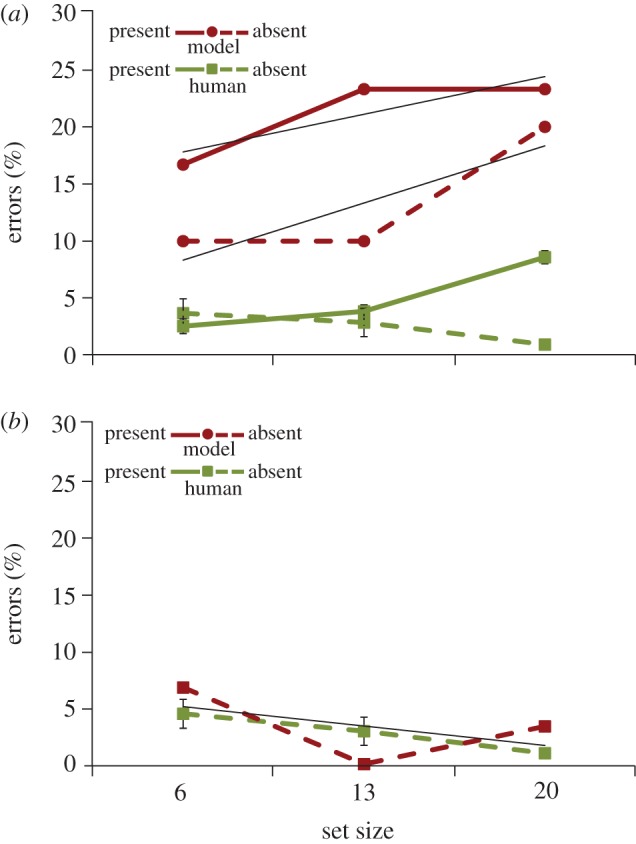
Figure 2.

Percentages of false negative (solid lines) and false positive (dashed lines) errors for the human searchers (green (light) lines) and the model (red (dark) lines) as a function of set size. Error bars attached to the behavioural means indicate a 95% CI and trend lines are fit to the model data. (a) Data from all trials, regardless of eye position relative to an object. (b) Data from target-absent trials in which gaze was within 1° of a distractor at the time of the target-present search decision. Note that the behavioural data are essentially unchanged from (a), reflecting the fact that human observers almost always looked at an object prior to making their search decision. (Online version in colour.)
