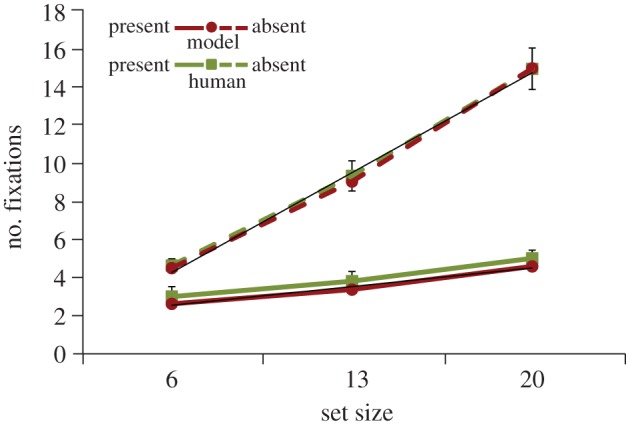
Figure 3.

The average number of fixations prior to the target-present (solid lines) and target-absent (dashed lines) search decisions for human searchers (green (light) lines) and the model (red (dark) lines) as a function of set size. Data are from correct trials only, and the initial fixation during search was included in the measure for both the model and the behavioural participants. Error bars attached to the behavioural means show 95% CIs and trend lines are fit to the model data. (Online version in colour.)
