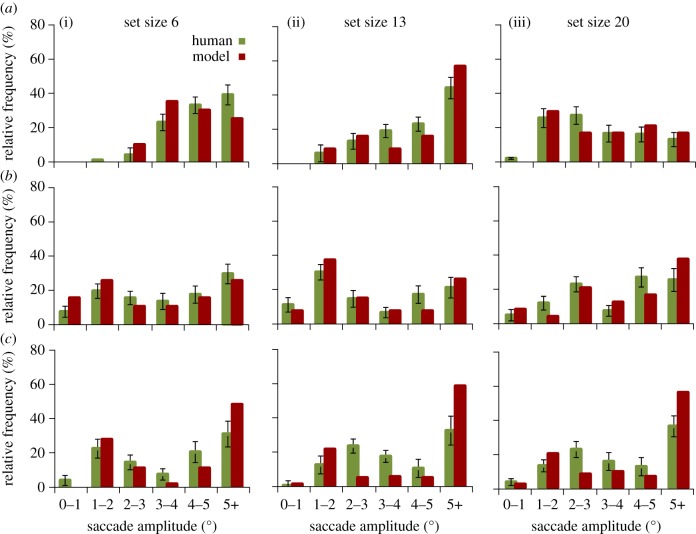
Figure 6.
Relative frequency histograms of mean saccade amplitudes on correct target-present trials for the first and second saccades made during search (row (a) and row (b), respectively), as well as the average amplitudes for all subsequent saccades (third and greater, row (c)). Analyses for the model are in red (dark), and human searchers in green (light). The 6, 13 and 20 set-size conditions are shown in (i, ii and iii), respectively. Error bars indicate 95% CIs. (Online version in colour.)

