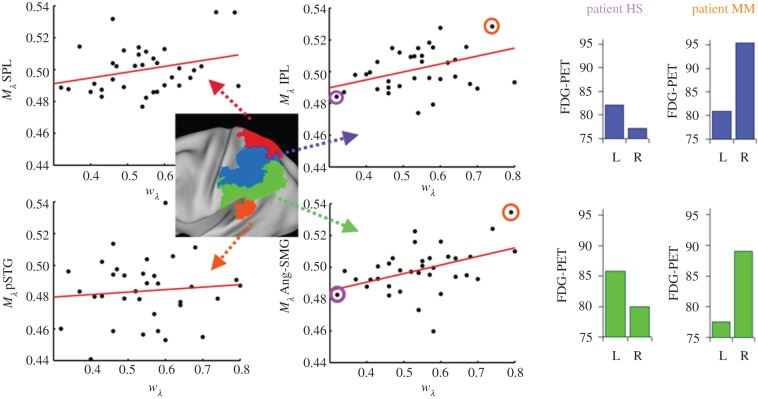
Figure 3.
Metabolic biases Mλ correlate with spatial bias wλ. In analogy to spatial bias wλ, we defined an index for the lateral bias of metabolism (Mλ) of a given brain region as Mright/(Mright + Mleft), where Mright or Mleft represents the mean metabolism in a right- or left-hemisphere ROI. Metabolic biases Mλ (y-axes) of the angular–supramarginal gyrus (Ang-SMG, lower middle panel; r = 0.44) and the inferior parietal lobe (IPL, upper middle panel; r = 0.41) correlate significantly with wλ (x-axes) (p < 0.05, Bonferroni-corrected for multiple testing); results were based on partial correlation analyses, including both mini-mental-status examination scores and mean metabolism of the posterior cingulate cortex measured by FDG-PET scores as additional covariates, in order to control for effects of general cognitive performance and brain metabolism. The right panel shows left- and right-hemisphere regional metabolism in the IPL (upper row) and Ang-SMG (lower row) in exemplary patients exhibiting either a right- (HS) or left-lateralized (MM) spatial attentional bias. Their location in the scatterplots is circled, HS on the left and MM on the right. (Adapted from Mintun et al. [19].) (Online version in colour.)

