
Figure 2.
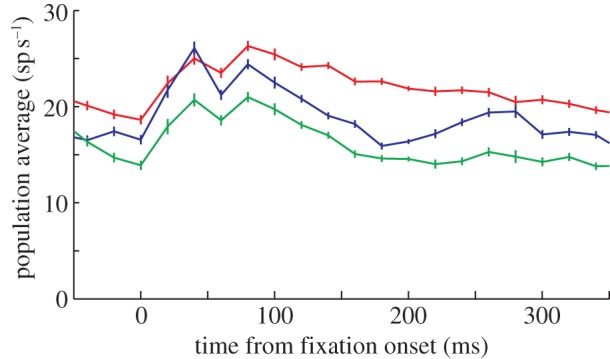
Averaged post-stimulus time histograms (20 ms non-overlapping bins) from all 69 single units collected from both monkeys performing the visual foraging task. Error bars represent the standard error of the mean (s.e.m.). Time is aligned by fixation onset, which represents the completion of the previous saccade. Red denotes target; blue denotes fixated T and green denotes distractor.