
Figure 4.
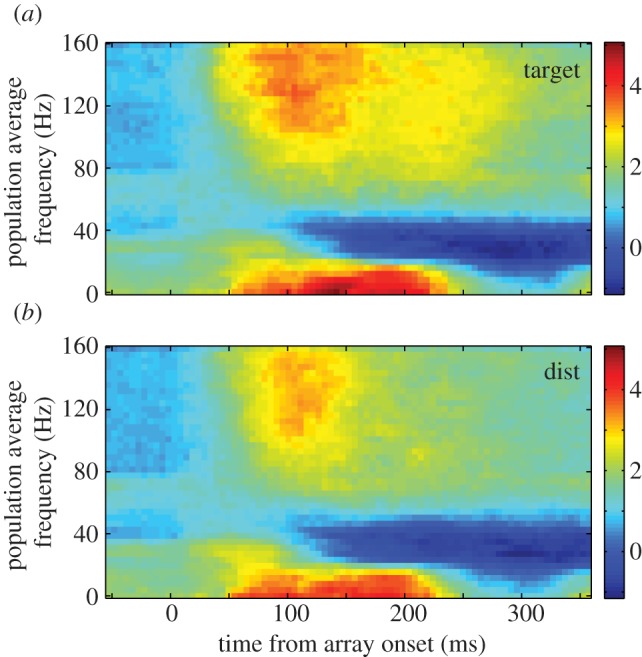
Averaged normalized LFP spectrograms across all recordings from both monkeys during initial fixation and array onset in the foraging task. Time–frequency plots of the spectrogram from trials in which a potential target (a) appeared in the response field of the single unit being recorded or in which a distractor (b) appeared in the response field. Power is colour-coded on a log scale.