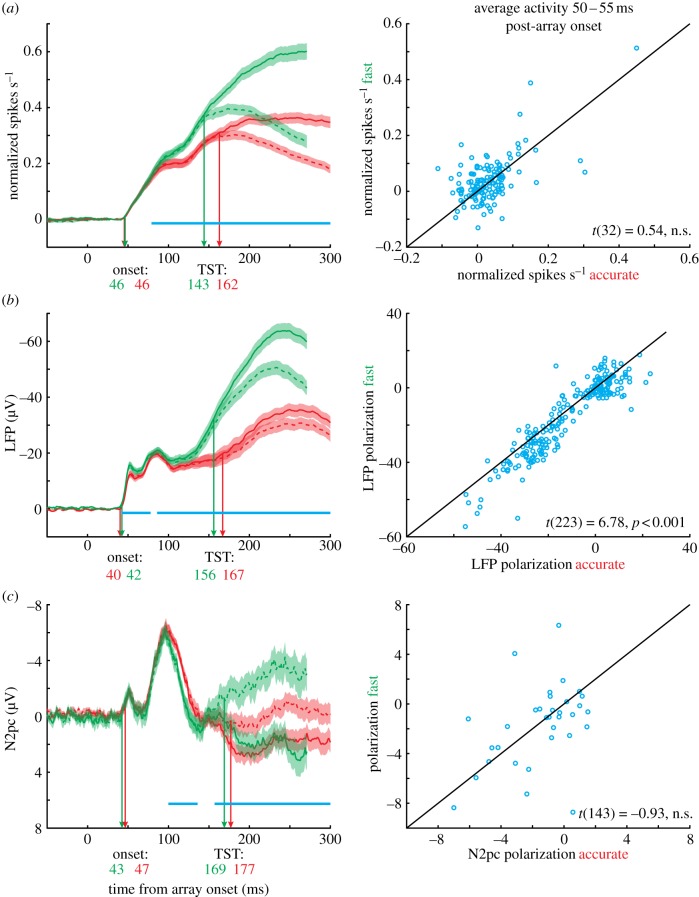
Figure 7.
(a) Chronometric analysis of single-units, (b) LFP and (c) N2pc. Note that single-unit activity has been baseline corrected so that visual responses of all three signals can be meaningfully compared. For each signal, we computed several metrics. The onset time was computed as the moment when neural signals differed significantly from baseline (average −100 to 0 ms prior to array appearance). Onset times were slightly earlier for LFP than for single units or N2pc (earliest arrows). The target selection time (TST) was the moment when neural activity discriminated target items (solid lines) from distractor items (dashed lines) in the RF. For the LFP and N2pc, the RF was defined as the contralateral hemifield. Note that LFPs typically express selection through an increased negativity, whereas N2pc tends to become more positive for target items. The TSTs were earliest for single units, followed by LFP, followed by N2pc. Moreover, selection times were later in the accurate than fast condition for each signal type. The SAT discrimination time was computed as the moment at which neural activity was significantly different for the fast and accurate conditions (blue lines indicate significant differences). This time was earliest for LFP, followed by single units, followed by N2pc. This pattern was evident across the population: scatter plots on the right compare average neural activity in the fast and accurate conditions from 50 to 55 ms post-array onset. The differences are significant only for the LFP.

