
Fig. 1.
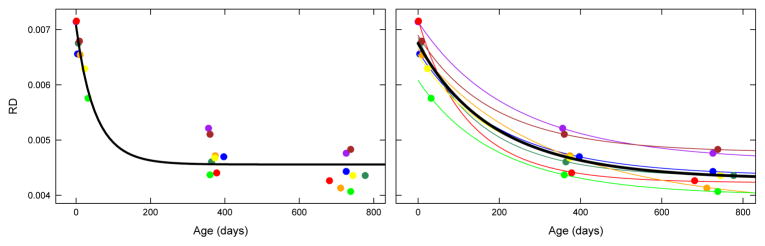
Population growth models, represented as black curves, obtained using nonlinear least squares (nls) on left and nonlinear mixed effect model (nlme) on right. Colored points represent data observations, and colored curves represent the individual growth trajectories.