
Fig. 3.
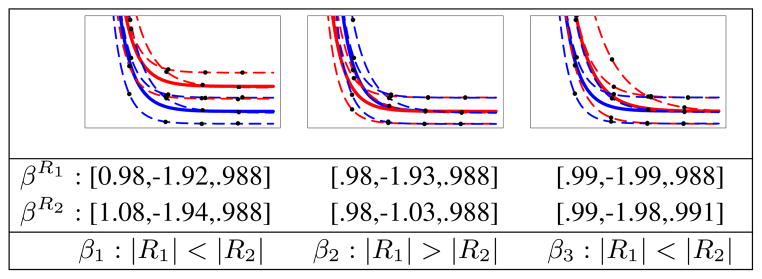
Example of randomly generated synthetic longitudinal data for two different regions colored blue (R1) and red (R2). Three different tests were performed. Left to right: varying β1, β2 and β3 between two regions. Estimated β parameters for regions R1 and R2 along with Gompertz parameters with significant differences (p < 0.001) are shown.