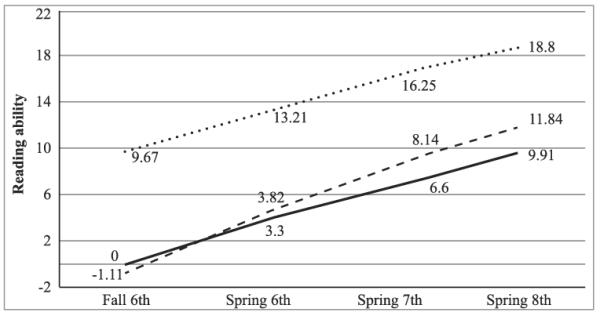
FIGURE 2. Reading Ability Factor Scores at Four Timepoints.

The solid line represents the BaU group, the dashed line represents the treatment group, and the dotted line represents the group of typical readers. The reading ability variable reflects the metric derived from the multiple-indicator, multilevel model.
