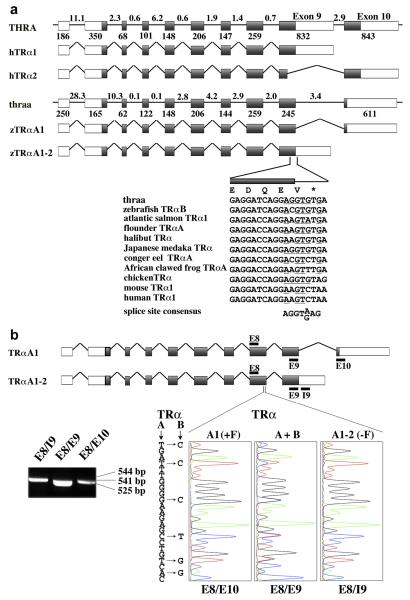
Fig. 5. Alternative splicing of Zebrafish TRαA exon 9 yields TRαA1 and TRαA1-2.
A, Comparison of exon-intron structure of the human THRA and zebrafish thraa genes and composition of THRA and thraa transcripts. Exons are identified by boxes and introns as lines; coding sequences are grey shaded. The lengths of introns (in kbp) are indicated above the introns; the length of exons (in bp) are shown below the exons. The sequences at the exon 9/intron 9-10 boundary of thraa is shown and compared with corresponding coding sequences for zebrafish TRαB (DQ017632), atlantic salmon TRα1 (AF146775), flounder TRαA (D16461), halibut TRα (AF143296), Japanese medaka TRα (AB114860), conger eel TRαA (AB183396), African clawed frog TRαA (M35343), chicken TRα (Y00987), mouse TRα1 (X5193), and human TRα1 (X55005). Nucleotides that are similar to the splice consensus sequence are underlined. B, Identification of TRαA1 (E8/E10), TRαA1-2 (E8/I9) and all TRα (E8/E9) transcripts by RT PCR using cDNA derived from 6 dpf embryos. Location of the PCR primers (black bars) and expected sizes of PCR fragments are indicated. Sequence analysis of these PCR products confirmed that the E8/E10 and E8/I9 products originate from TRαA1 and TRαA1-2 transcripts, respectively. The E8/E9 PCR product contained a mixture of TRαA and TRαB sequences (“C”- blue, “G”-black, “T”-red, “A”-green).

