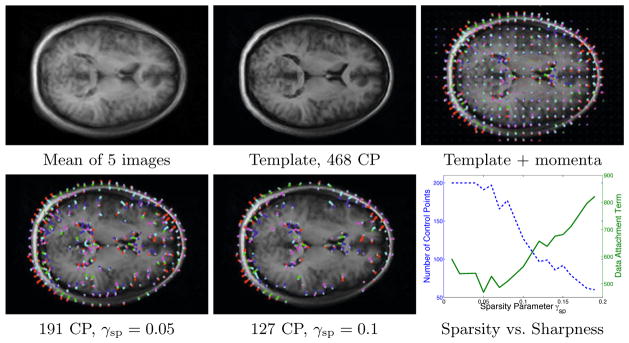
Fig. 5.

Atlas from 5 brain images. Top row: estimated atlas with update of control points but without sparsity enforced. Bottom row: with enforced sparsity, the control points focus on the skull, the ventricles and the major sulci. The graph shows that we can achieve an equivalent description of the variability with 40.8% to 27.1% of the original 468 momenta, for γsp ∈]0, 0.1]. σ = 5, γ = 5 10−3.
