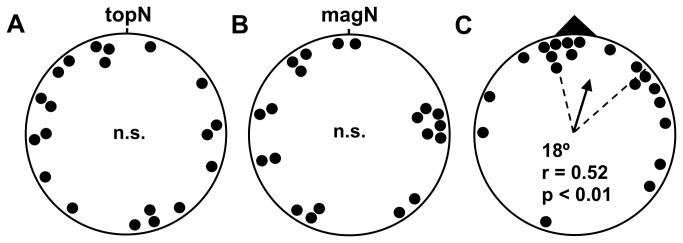
Figure 2. C57BL/6 mice rapidly learn the magnetic direction of a submerged platform in the plus water maze (data in Table S2).

Directional responses from mice given two training trails in the late afternoon (Figure 1A & B), and then tested the following morning (Figure 1C). A) The distribution of topographic bearings, i.e., deviations from the north arm of the maze (topN), was indistinguishable from random (p > 0.10, Rayleigh test). B) The same was true of the distribution of magnetic bearings, i.e., deviations from the alignment of magnetic north in testing (magN). C) In contrast, the distribution of bearings relative to the trained magnetic direction (black triangle) was non-randomly distributed, and the 95% confidence interval for the mean vector bearing contained the trained direction. Each data point is the directional response of a single mouse tested in one of the four magnetic field alignments (see Methods & Methods). Arrow in the center of (C) is the mean vector for distributions of bearings that are non-randomly distributed. The length of the arrow is proportional to the mean vector length (r), a measure of the clustering of bearings ranging from 0 to 1; radius of the circle corresponds to r = 1. Dashed lines show the 95% confidence interval for the mean vector bearing [52]. ‘n.s.’- not significant (p > 0.10; Rayleigh Test).
