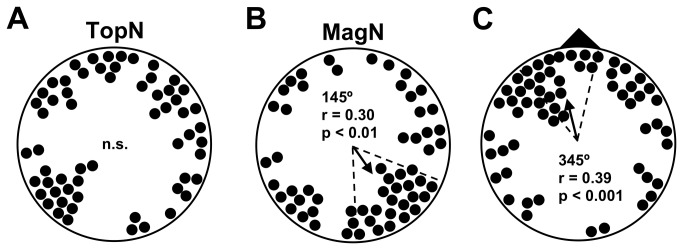
Figure 3. Replication of learned response (data in Table S3).

A) The distribution of topographic bearings was indistinguishable from random (p > 0.10, Rayleigh test). B) The distributions of magnetic bearings from north- and south-trained mice were significantly different (p < 0.02, U2=0.253 Watson U2 test). Due to the unequal sample sizes (Table S3), however, these responses did not cancel out and the overall distribution of magnetic bearings was non-randomly distributed. C) The distribution of bearings relative to the trained magnetic direction (black triangle) was non-randomly distributed, and the 95% confidence interval for the mean vector bearing contained the trained direction.
