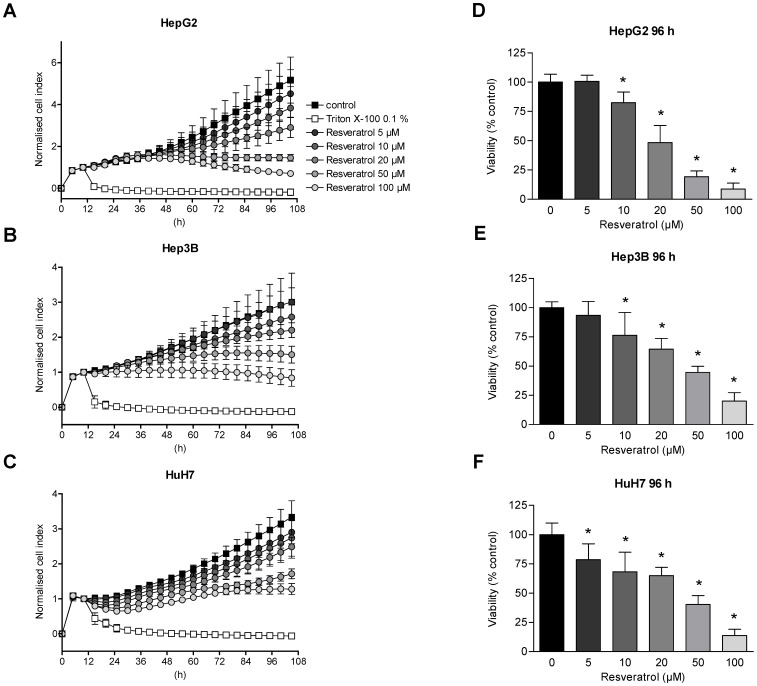
Figure 3. Reduced proliferation and viability of hepatoma cells by resveratrol.
(A–C) HepG2 (A), Hep3B (B) and HuH7 (C) hepatoma tumor cells were treated with different concentrations of resveratrol (5 µM, 10 µM, 20 µM, 50 µM and 100 µM) or solvent as control and monitored for an additional time period of 96 h. Cellular impedance was measured over the entire observation time using the xCELLigence™ SP system and calculated by the RTCA Software 1.2.1.1002. All cell index (CI) values were normalized when treatment started. Displayed are normalized CI values every 5 h. As a positive control for cell death, Triton X-100 0.1% was used. (D–F) Sulforhodamine B (SRB) assay of HepG2 (D), Hep3B (E) and HuH7 (F) cells treated with increasing concentrations of resveratrol (5 µM, 10 µM, 20 µM, 50 µM and 100 µM) or solvent as control for 96 h. Shown are mean ± SD of three independent experiments, each performed in triplicates (A–F); One-way ANOVA Dunnetts multiple comparison test, *P<0.01 (D–F).

