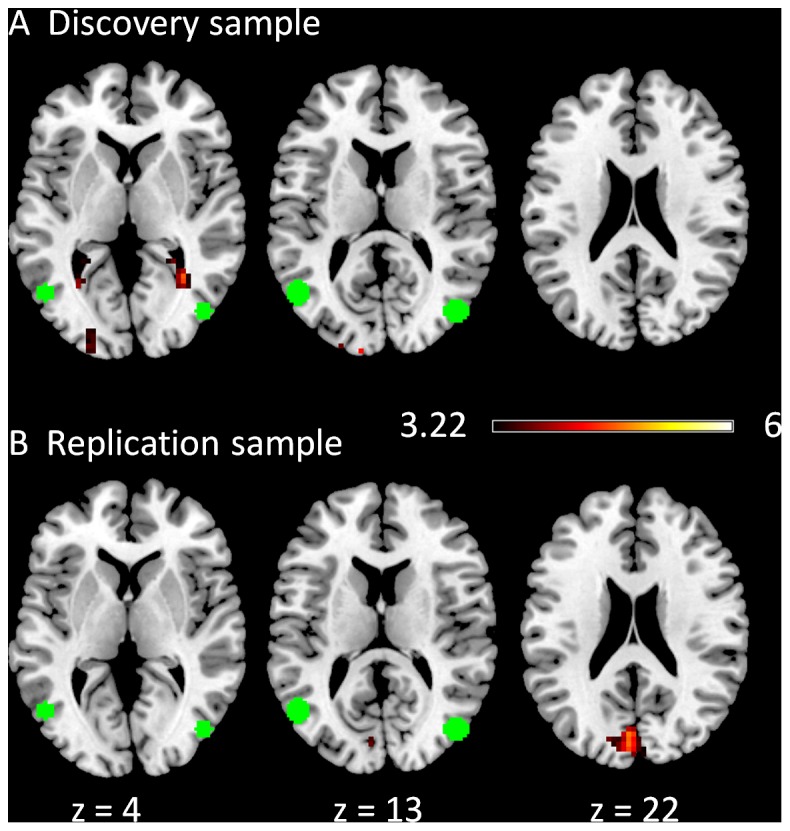
Figure 6. Clusters correlated with positive (in hot) and negative (in cold) modulation effect of the functional connectivity between the two extrastriate network ROIs in the discovery (A) and replication (B) samples.

The green circles represent the ROIs used in this PPI analysis. The maps were thresholded at p<0.05 FDR corrected with a heigth threshold of p<0.001. The z values represent the coordinates in the MNI space.
