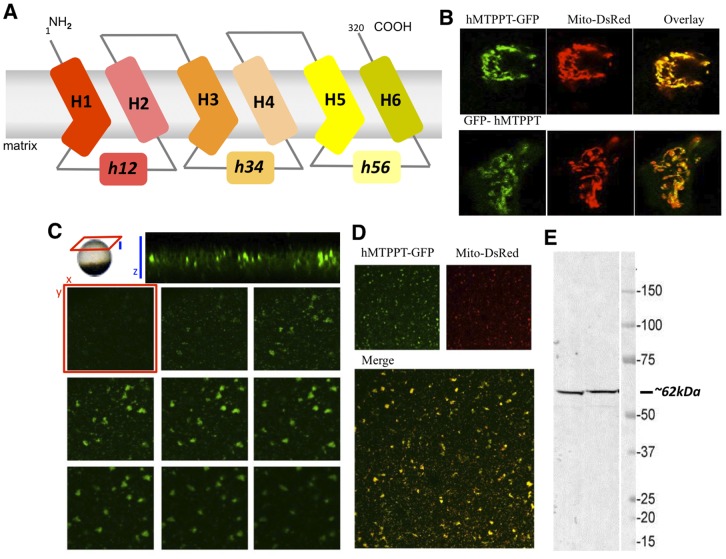
Figure 3. Cellular distribution of hMTPPT-GFP or GFP-hMTPPT in HepG2 cells and X. Oocytes.
A) Predicted 6 transmembrane domains of hMTPPT showing the location of three-fold tandem repeated domains and both NH2 and COOH-terminals oriented towards the cytosol. B) Lateral (xy) confocal images of hMTPPT-GFP or GFP-hMTPPT co-transfected with DsRed-Mito (mitochondrial marker) and their overlay in HepG2 cells. C) Resolution of hMTPPT-GFP expression in a Xenopus oocyte. Top, axial image (‘xz’, blue) of a cortical band of hMTPPT-GFP expression. Individual lateral (‘xy’, red) images are displayed as image planes taken at successive 1 µm intervals into the oocyte cortex. D) Lateral (xy) confocal images of hMTPPT-GFP co-transfected with DsRed-Mito and their overlay in Xenopus oocyte. E) Western blot was performed on two individual hMTPPT-GFP expressing oocytes and probed with mouse anti-GFP (1∶1000) and goat anti-mouse antibodies (1∶5000).

