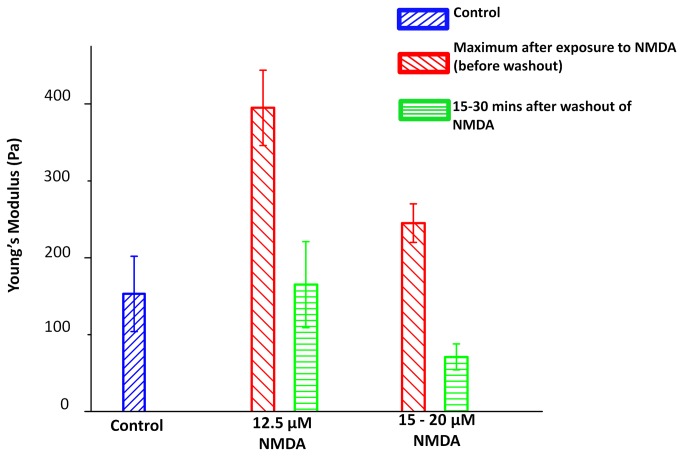
Figure 5. Mechanical responses of neuronal somata to exposure to NMDA.
Young’s moduli of the control neurons before treatment (blue, n=11); maximum values of Young’s modulus after exposure to 12.5 µM (red, n=7) and 15-20 µM NMDA (red, n=7) before washout; and averaged values measured during the 15-30 mins after wash-out of NMDA (green). Error bars were calculated as standard errors.

