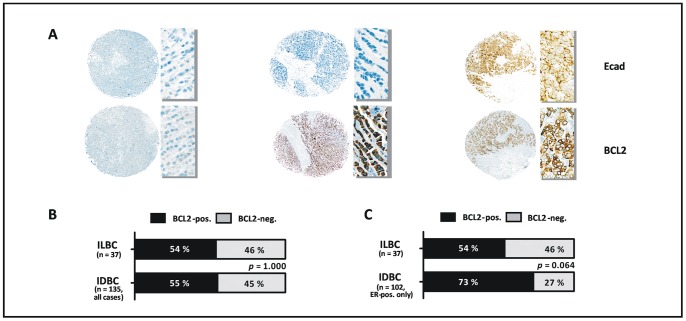
Figure 3. Primary ILBCs lack E-cadherin expression and are frequently BCL2-negative.
(A) Representative immunohistochemical stainings of two primary ILBCs (left, middle) and one primary IDBC (right) for E-cadherin (Ecad) and BCL2, as performed on TMAs. An overview of the tumor cores embedded in the TMAs is shown on the left side of each cases and a detail photomicrograph (magnification, ×400) is shown on the right side of each case. (B) Comparison of the frequency of BCL2-positive/−negative cases in ILBCs versus IDBCs. Statistical significance was determined with Fisher’s exact test. (C) Comparison of BCL2 positive/−negative cases in ILBCs versus ER-positive IDBCs.

