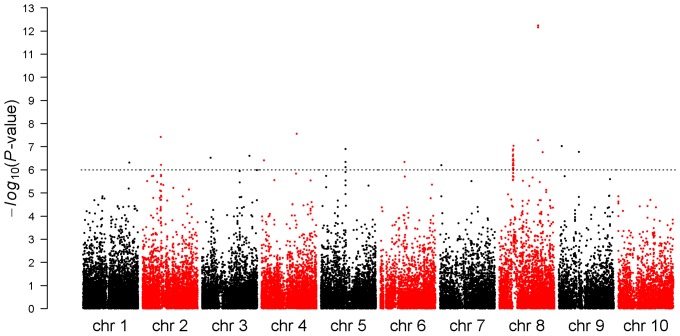
Figure 2. Manhattan plot for female flowering (FFLW8) associations across the whole genome.
P-values were obtained with the mixed model including the structure matrix obtained using STRUCTURE software and 55 SSRs and the kinship matrix obtained with 94 SSRs and IBS measure. Horizontal dashed line indicates Bonferroni-corrected 5% significance threshold.

