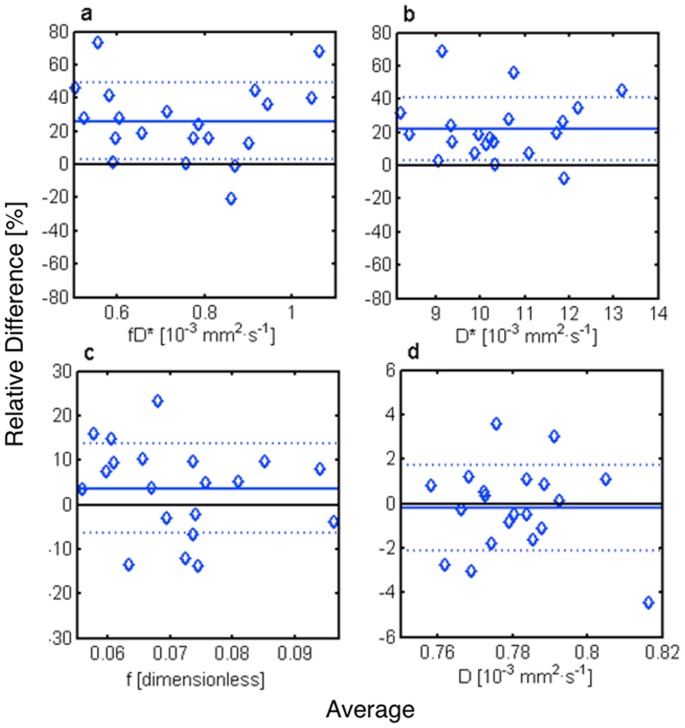
Figure 4. Bland Altman plots showing the relative difference between systole and diastole vs. their average for the blood flow related fD* (a), the pseudo-diffusion coefficient D* (b), the perfusion fraction f (c), and the diffusion coefficient D (d).
The mean relative difference (straight line) ± standard deviation (dotted line) were fD* = 26.1±23.0%, D* = 22.0±18.6%, f = 3.6±10.1% and D = −0.2±1.9%.

