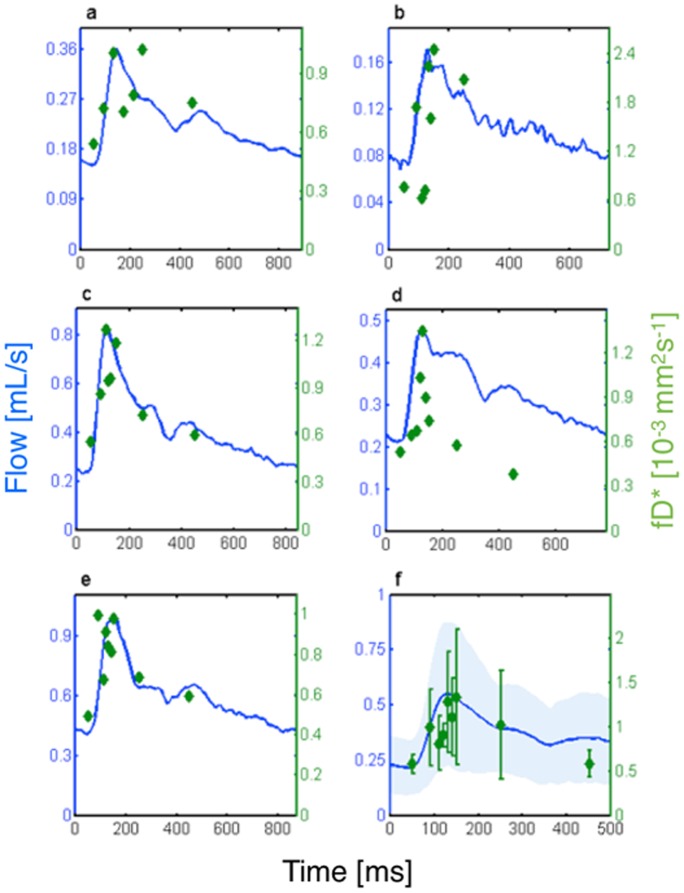
Figure 5. Phase contrast flow measurement (blue) and blood flow related parameter, fD*, as function of the cardiac cycle for five subjects (a–e).
(f) Group average (errorbars give ± standard deviation) of fD* overlaid on a group average of flow measurements in the ACA (shading gives ± standard deviation).

